Insights
Menu Engineering Matrix: How to Design a Menu That Sells (2026 Guide)
Learn the menu engineering matrix with a worked example: the formulas, how to sort dishes into Stars, Plowhorses, Puzzles and Dogs, and what to fix first.
Updated: November 19, 2026
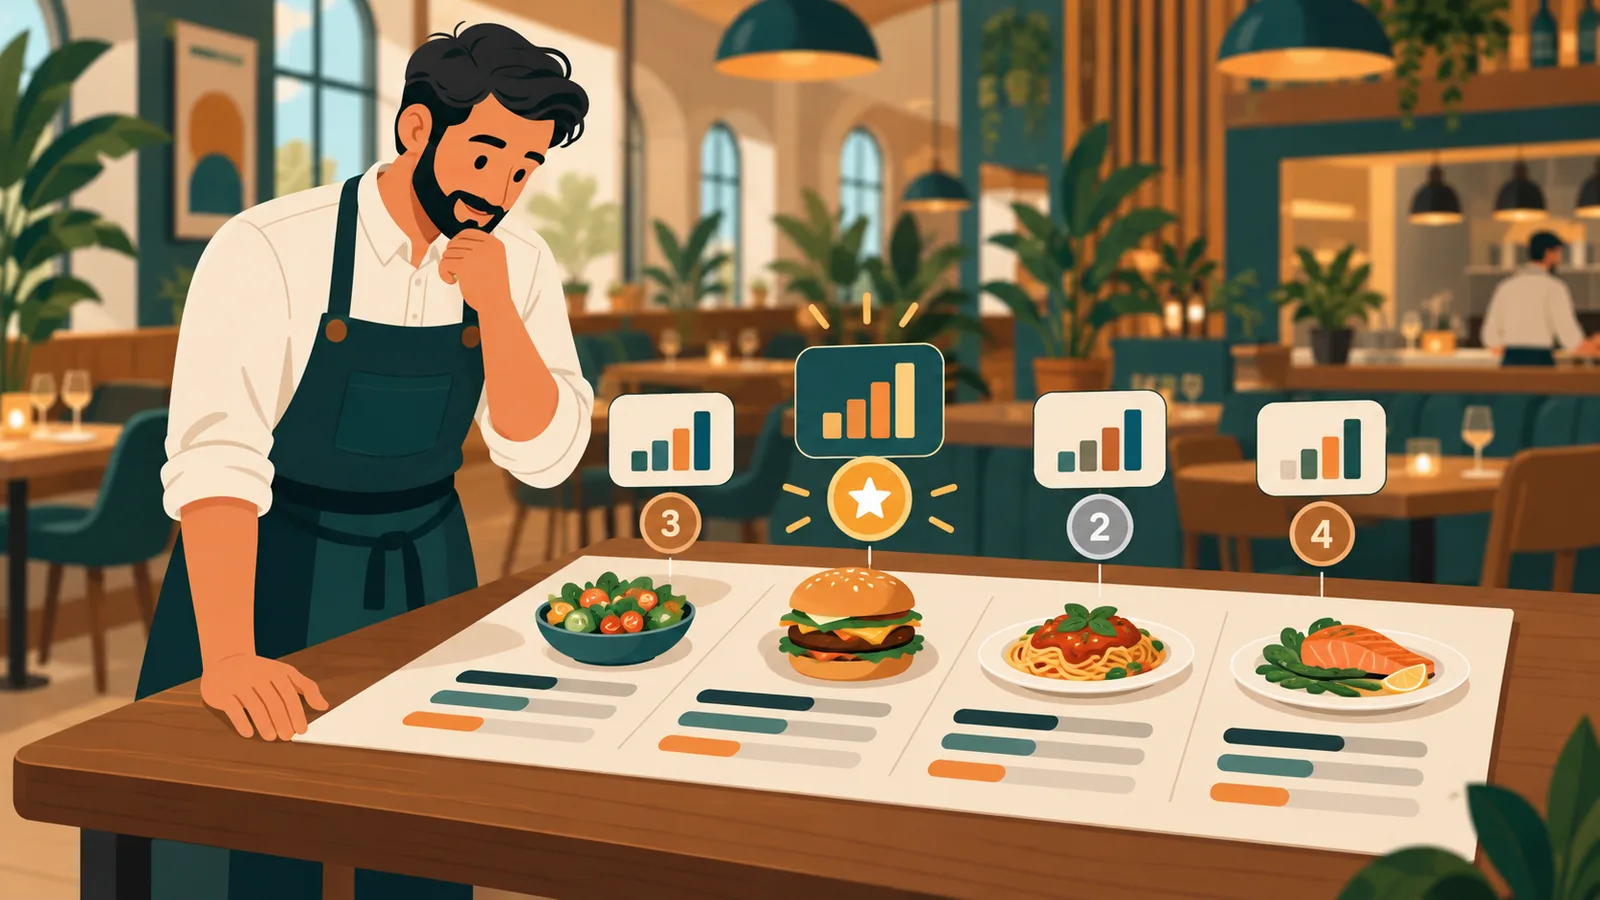
Menu engineering is a method for scoring every dish on two numbers, how often it sells and how much contribution margin it earns per sale, and sorting it into a four-box matrix: Stars, Plowhorses, Puzzles and Dogs. Each box comes with a clear action, from featuring a dish to repricing, rewriting or removing it. All you need is item-level sales data and the food cost of each dish.
What if the most profitable change in your restaurant this year costs nothing but a few hours of analysis? That is the promise of menu engineering. In 2026, with food costs and rents squeezing margins, it has moved from a consultant's trick to a basic skill for restaurant owners. This guide walks through the matrix, the formulas behind it, a worked example and what to do with each category.
What is menu engineering?
Menu engineering is the practice of measuring every item on your menu along two dimensions - how often it sells (popularity) and how much money it makes per sale (profitability) - and then using that map to decide pricing, placement, promotion and portioning. The method was introduced by Michael Kasavana and Donald Smith of Michigan State University in the early 1980s and is now standard practice in restaurant management.
The key metric is the contribution margin: the selling price of a dish minus its food cost. A low food-cost percentage alone does not make a dish your best dish. A $14 pasta with a $3 food cost earns you $11 every time it leaves the kitchen; a $28 steak with a $12 food cost earns $16 but may sell half as often. Menu engineering forces you to look at both numbers together, per item, with real sales data instead of gut feeling. If you have not priced your dishes from food cost yet, start with our restaurant menu pricing guide.
What is the menu engineering matrix?
The menu engineering matrix (also called the menu matrix) is a two-by-two grid. One axis is popularity, the other is contribution margin. Each dish is compared with your own menu's averages and lands in one of four boxes:
Category | Popularity | Contribution margin | What it means | What to do |
|---|---|---|---|---|
Star | High | High | Your best dishes: guests love them and they earn well | Protect quality, give them prime placement and a photo, never discount |
Plowhorse | High | Low | Guest favorites that earn too little per plate | Small price increase, adjust portion or recipe cost, pair with high-margin sides and drinks |
Puzzle | Low | High | Profitable dishes that guests overlook | Move next to Stars, rename, rewrite the description, add a photo, have servers recommend them |
Dog | Low | Low | Dishes that cost you ingredients and menu space | Rework if strategic (dietary or kids' option), otherwise remove |
Stars: high popularity, high profitability
Your best dishes. Keep the quality consistent, give them the most visible positions on the menu, show them with photos and never discount them. A star that quietly drops in quality can take your whole average check down with it.
Plowhorses: high popularity, low profitability
Guest favorites that do not earn enough per plate. Do not remove them - they bring people through the door. Instead, work the margin: small price increases, slightly adjusted portions, or pairing them with high-margin sides and drinks so the total check grows.
Puzzles: low popularity, high profitability
Hidden money-makers. They usually suffer from bad placement, a weak name or description, or the lack of a photo. Move them next to your Stars, rewrite the description, add an appetizing photo, or have servers recommend them by name.
Dogs: low popularity, low profitability
Dishes that cost you twice: once in ingredients and again in menu space. Rework them if they serve a strategic purpose (the one vegan option, the kids' dish); otherwise let them go and free the kitchen.
How do you calculate the menu engineering matrix?
You need three numbers per dish for a fixed period (for example the last 8 weeks): units sold, selling price and food cost. Then:
Contribution margin per dish = selling price - food cost.
Average contribution margin = total contribution margin of the category ÷ total units sold in that category. Dishes above this average are "high profitability".
Menu mix % = units sold of a dish ÷ total units sold in the category.
Popularity threshold = (1 ÷ number of dishes in the category) × 70%. In the classic Kasavana and Smith method, a dish counts as "high popularity" if its menu mix is at or above this threshold. With 10 mains, the threshold is 10% × 0.7 = 7%.
Always analyze one category at a time (starters, mains, desserts, drinks). Comparing a dessert with a steak tells you nothing useful.
What does a menu engineering example look like?
Here is a simplified worksheet for an example restaurant with five main courses over eight weeks. The numbers are illustrative.
Dish | Units sold | Menu mix | Price | Food cost | Contribution margin | Category |
|---|---|---|---|---|---|---|
Grilled chicken | 420 | 35% | $18 | $6 | $12 | Plowhorse |
Ribeye steak | 300 | 25% | $34 | $14 | $20 | Star |
Seafood risotto | 90 | 7.5% | $26 | $8 | $18 | Puzzle |
Mushroom pasta | 300 | 25% | $16 | $4 | $12 | Plowhorse |
Stuffed peppers | 90 | 7.5% | $15 | $6 | $9 | Dog |
Total units: 1,200. Total contribution margin: $17,070, so the average margin is about $14.23. The popularity threshold for five dishes is 20% × 0.7 = 14%. The steak is above both lines (Star). Chicken and pasta sell well but earn below average (Plowhorses). The risotto earns well but sells below 14% (Puzzle), and the peppers are below both (Dog). The next step would be a photo and better placement for the risotto, a small price or portion change on the chicken, and a decision on the peppers.
How do you do menu engineering step by step?
Collect sales data per item. Export at least 4-12 weeks of item-level sales from your POS or digital menu analytics. More data means fewer wrong calls.
Calculate contribution margins. For every dish: selling price minus food cost. Then compute the category's average margin and popularity threshold.
Classify every dish. Place each item in the matrix by comparing it against those lines.
Redesign the menu. Reposition Stars, fix Puzzle descriptions and photos, adjust Plowhorse pricing, cut or rework Dogs.
Measure and repeat. Menu engineering is a cycle, not a one-time project. Review the results after a few weeks and adjust again.
How does menu design support menu engineering?
The matrix tells you what to change; menu design is how guests notice the change. A few principles that work on paper and on screen:
Give Stars and Puzzles the first positions in each category, where guests start reading.
Use photos selectively. A photo next to every dish dilutes attention; photos on Stars and Puzzles direct it.
Write descriptions that sell: ingredients, origin and cooking method instead of generic adjectives. Clear allergen and portion information builds trust; see our guide to allergens, calories and portions on digital menus.
Keep categories short so the eye is not lost in long lists.
Translate the menu if you serve tourists, otherwise your data reflects what guests could decipher rather than what they wanted. Our multilingual menu guide covers how.
Why do digital menus make menu engineering continuous?
The classic process was built for a paper world: collect data for a quarter, redesign the menu, print it, wait another quarter. A digital menu compresses that cycle to days:
Live analytics: you see views per dish as they happen instead of waiting for a quarterly export.
Instant updates: price changes, new photos and rewritten descriptions go live the same minute - no reprinting, no stickers over old prices.
Easy testing: move a Puzzle dish to the top of its category, add a photo, and watch whether it moves this week.
Foost was built around this loop: the Foost digital menu shows you which dishes guests look at and lets you change prices, photos and descriptions instantly, so the menu keeps improving every week instead of once a year.
What data should inform a menu redesign?
A menu redesign should rest on item-level numbers, not on what the team feels is popular. Collect these for each category over the same period:
Units sold per dish from your POS, to calculate menu mix.
Current food cost per dish from up-to-date recipe costing, not last year's supplier prices.
Selling price, so you can calculate contribution margin.
Dish views or clicks if you use a digital menu. A dish that is viewed often but rarely ordered usually has a price, description or photo problem; a dish that is rarely viewed has a placement problem.
Prep time and kitchen load for dishes that slow the line at peak hours.
Guest feedback and reviews that mention specific dishes.
Which dishes should you cut after a menu engineering analysis?
Start with the Dogs, but do not cut on the matrix alone. Remove a Dog when it has no strategic role, uses ingredients that nothing else on the menu uses, and slows the kitchen. Keep or rework it when it is the only dietary option in its category, a kids' dish, or a signature item guests come for. Plowhorses should almost never be cut; they need a better margin, not removal. Before you cut, check that the dish was not simply hidden in a bad position: a dish nobody sees will always look like a Dog.
How can you lift margins without raising prices?
Re-cost recipes and adjust portions or garnish on Plowhorses where guests will not notice the difference.
Promote Puzzles with better placement, photos and server recommendations, so the sales mix shifts toward higher-margin dishes.
Pair popular dishes with high-margin add-ons such as sides, sauces and drinks.
Cut Dogs that tie up inventory, which reduces waste as well as menu clutter.
Cross-utilize ingredients across several dishes to lower purchasing and waste.
How do you apply menu engineering to seasonal menus and multi-unit groups?
For seasonal menus, analyze only the weeks a dish was actually on the menu and compare it with the other dishes in the same season, not with last season's averages. Run the analysis a few weeks after each seasonal launch so you can still adjust before the season ends. For multi-unit groups, run the matrix per location first: the same dish can be a Star in one neighborhood and a Puzzle in another. Then compare locations to decide which changes belong on the shared core menu and which stay local.
How often should you re-run a menu engineering analysis?
Most restaurants re-run the analysis every quarter, and again after any major change: a new seasonal menu, a price update, or a large shift in supplier costs. With a digital menu that shows views per dish, you can check the numbers monthly and make small adjustments between full reviews.
What menu engineering mistakes should you avoid?
Judging by food-cost percentage alone. A low food-cost dish that never sells earns you less than a higher-cost dish that flies out of the kitchen.
Mixing categories. Analyze starters, mains, desserts and drinks separately.
Changing everything at once. If you reprice ten dishes and rearrange the whole menu in one week, you cannot tell what worked. Change a few things, measure, continue.
Cutting Dogs without thinking. Some low performers serve a strategic purpose - dietary options, kids' dishes, or a signature item your brand is known for.
Forgetting the floor team. Servers who know which dishes are Stars and Puzzles move the numbers faster than any layout change.
Menu engineering is one of several levers; for the others, see 5 ways to increase your restaurant revenue.
Conclusion
Menu engineering turns your menu from a static price list into your hardest-working salesperson. Score your dishes on popularity and contribution margin, sort them into the matrix, and improve the menu in small, measured cycles. If you want the data to collect itself and every change to go live instantly, you can compare plans on our packages page.
FAQ
- What is menu engineering in a restaurant?
- Menu engineering is the practice of analyzing each menu item's popularity and profitability, then using that data to decide pricing, placement and promotion. Developed at Michigan State University in the 1980s, it is now standard practice for data-driven restaurants.
- How often should you do menu engineering?
- Review your menu at least every quarter. With a digital menu that tracks dish views automatically, many restaurants check their numbers monthly and make small continuous adjustments instead of one big yearly redesign.
- What is the menu engineering matrix?
- The matrix classifies each dish into four categories by popularity and profitability: Stars (high on both - protect and feature them), Plowhorses (popular but low margin - improve the margin carefully), Puzzles (profitable but unpopular - improve visibility and descriptions) and Dogs (low on both - rework or remove).
- Do I need special software for menu engineering?
- No. A spreadsheet is enough: list units sold, price and food cost per dish, then calculate contribution margin, menu mix and the popularity threshold. What matters is accurate item-level sales data from your POS. A digital menu adds view data per dish and lets you apply changes instantly.
- What is a good contribution margin for a menu item?
- There is no universal number. Menu engineering compares each dish with the average contribution margin of its own category, so a dish is "high profitability" when it earns more per sale than that average. Track the average over time rather than chasing an industry benchmark.
- How do you calculate the popularity threshold in menu engineering?
- Divide 1 by the number of dishes in the category and multiply by 70%. With 10 main courses the threshold is 7%: any main whose share of total main-course sales is 7% or higher counts as high popularity. This 70% rule comes from the original Kasavana and Smith method.